Distributed ARIMA models for Ultra-long Time Series
Xiaoqian Wang
Beihang University
AMSI Winter School 2021
Joint work with
 |
 |
 |
|---|---|---|
| Yanfei Kang | Rob J Hyndman | Feng Li |
| Beihang University | Monash University | Central University of Finance and Economics |
Motivation
Ultra-long time series are increasingly accumulated in many cases.
- hourly electricity demands
- daily maximum temperatures
Forecasting these time series is challenging.
- time-consuming training process
- hardware requirements
- unrealistic assumption that the DGP remains invariant over a long time interval
Some attempts are made in the vast literature.
- discard the earliest observations
- allow the model itself to evolve over time
- apply a model-free prediction
- develop methods using the Spark’s MLlib library
P1: Ultra-long time series are becoming increasingly common. Examples include hourly electricity demands spanning several years, daily maximum temperatures recorded for hundreds of years, and streaming data
P2: It is challenging to deal with such long time series. We identify three significant challenges, including:
- time-consuming training process, especially parameters optimization
- hardware requirements
- unrealistic assumption that the DGP remains invariant over a long time interval
P3: Forecasters have made some attempts to address these limitations.
- a straightforward approach is to discard the earliest observations, it only works well for forecasting a few future values
- allow the model itself to evolve over time, such as ARIMA and ETS
- apply a model-free prediction assuming that the series changes slowly and smoothly with time (2,3) require considerable computational time in model fitting and parameter optimization, making them less practically useful in modern enterprises
- develop methods using the Spark’s MLlib library. However, the platform does not support the multi-step prediction, convert the multi-step time series prediction problem into H sub-problems, H is the forecast horizon In this work, we intend to provide a preferable way to solve these challenges
Electricity load data
The Global Energy Forecasting Competition 2017 (GEFCom2017)
Ranging from March 1, 2003 to April 30, 2017 ( 124,171 time points)
10 hourly electricity load series
Training periods
March 1, 2003 - December 31, 2016Test periods
January 1, 2017 - April 30, 2017
( h=2,879 )
 An example series from GEFCom2017 dataset.
In this work, we want to find a better way to resolve all challenges associated with forecasting ultra-long time series. (...) Inspired by this, we aim to extend the DLSA method to solve the time series modeling problem.
Distributed forecasting
Parameter estimation problem
For an ultra-long time series {yt;t=1,2,…,T}. Define S={1,2,⋯,T} to be the timestamp sequence.
The parameter estimation problem can be formulated as f(θ,Σ|yt,t∈S).
Distributed forecasting
Parameter estimation problem
For an ultra-long time series {yt;t=1,2,…,T}. Define S={1,2,⋯,T} to be the timestamp sequence.
The parameter estimation problem can be formulated as f(θ,Σ|yt,t∈S).
Suppose the whole time series is split into K subseries with contiguous time intervals, that is S=∪Kk=1Sk.
The parameter estimation problem is transformed into K sub-problems and one combination problem as follows: f(θ,Σ|yt,t∈S)=g(f1(θ1,Σ1|yt,t∈S1),…,fK(θK,ΣK|yt,t∈SK)).
We identify the parameter estimation problem as this formula ~.
Distributed forecasting

The proposed framework for time series forecasting on a distributed system.
- Step 1: Preprocessing.
- Step 2: Modeling.
- Step 3: Linear transformation.
- Step 4: Estimator combination.
- Step 5: Forecasting.
Why focus on ARIMA models
ARIMA models
the most widely used statistical time series forecasting approaches.
frequently serve as benchmark methods for model combination.
handle non-stationary series via differencing and seasonal patterns.
the automatic ARIMA modeling was developed to easily implement the order selection process (Hyndman & Khandakar, 2008).
be converted into AR representations (linear form).
The automatic ARIMA modeling mainly consists of 3 steps... Where the order selection and model refit process are time-consuming for ultra-long time series. The time spend in forecasting one electricity demand series ranges from 20 minutes to 2 hours. So, it is necessary to develop a new approach to make ARIMA models work well for ultra-long series.
AR representation
- A seasonal ARIMA model is generally defined as (1−p∑i=1ϕiBi)(1−P∑i=1ΦiBim)(1−B)d(1−Bm)D(yt−μ0−μ1t)=(1+q∑i=1θiBi)(1+Q∑i=1ΘiBim)εt.
AR representation
A seasonal ARIMA model is generally defined as (1−p∑i=1ϕiBi)(1−P∑i=1ΦiBim)(1−B)d(1−Bm)D(yt−μ0−μ1t)=(1+q∑i=1θiBi)(1+Q∑i=1ΘiBim)εt.
The linear representation of the original seasonal ARIMA model can be given by yt=β0+β1t+∞∑i=1πiyt−i+εt, where β0=μ0(1−∞∑i=1πi)+μ1∞∑i=1iπiandβ1=μ1(1−∞∑i=1πi).
For a general seasonal ARIMA model, by using multiplication and long division of polynomials, we can obtain the final converted linear representation in this form. In this way, all ARIMA models fitted for subseries can be converted into this linear form.
Estimators combination
Some excellent statistical properties of the global estimator obtained by DLSA (Distributed Least Squares Approximation) has been proved (Zhu, Li & Wang 2021, JCGS).
We extend the DLSA method to solve time series modeling problem.
Define L(θ;yt) to be a second order differentiable loss function, we have L(θ)=1TK∑k=1∑t∈SkL(θ;yt)=1TK∑k=1∑t∈Sk{L(θ;yt)−L(^θk;yt)}+c1≈1TK∑k=1∑t∈Sk(θ−ˆθk)⊤¨L(^θk;yt)(θ−^θk)+c2≈K∑k=1(θ−^θk)⊤(TkTˆΣ−1k)(θ−^θk)+c2.
- The next stage entails solving the problem of combining the local
- Taylor’s theorem & the relationship between the Hessian and covariance matrix for Gaussian random variables
- This leads to a weighted least squares form
Estimators combination
The global estimator calculated by minimizing the weighted least squares takes the following form ~θ=(K∑k=1TkTˆΣ−1k)−1(K∑k=1TkTˆΣ−1k^θk),~Σ=(K∑k=1TkTˆΣ−1k)−1.
ˆΣk is not known and has to be estimated.
We approximate a GLS estimator by an OLS estimator (e.g., Hyndman et al., 2011) while still obtaining consistency.
We consider approximating ˆΣk by ^σ2kI for each subseries.
The global estimator and its covariance matrix can be obtained. The covariance matrix of subseries is not known, so we estimate it by sigma2I.
Output forecasts
The h-step-ahead point forecast can be calculated as ^yT+h|T=~β0+~β1(T+h)+⎧⎪ ⎪ ⎪⎨⎪ ⎪ ⎪⎩∑pi=1~πiyT+1−i,h=1∑h−1i=1~πi^yT+h−i|T+∑pi=h~πiyT+h−i,1<h<p.∑pi=1~πi^yT+h−i|T,h≥p
The central (1−α)×100% prediction interval of h-step ahead forecast can be defined as ^yT+h|T±Φ−1(1−α/2)~σh.
The standard error of h-step ahead forecast is formally expressed as ~σ2h=⎧⎨⎩~σ2,h=1~σ2(1+∑h−1i=1~θ2i),h>1, where ~σ2=tr(~Σ)/p.
Then, the point forecasts and prediction intervals can be obtained.
Experimental setup
Number of subseries: 150
- the length of each subseries is about 800
- the hourly time series in M4 ranges from 700 to 900
- the time consumed by automatic ARIMA modeling process is within 5 minutes
AR order: 2000
The experiments are carried out on a Spark-on-YARN cluster
- one master node and two worker nodes
- each node contains 32 logical cores, 64 GB RAM and two 80GB SSD local hard drives
Distributed forecasting results
Benchmarking the performance of DARIMA against ARIMA model and its AR representation.

The rationality of setting the AR order to 2000.
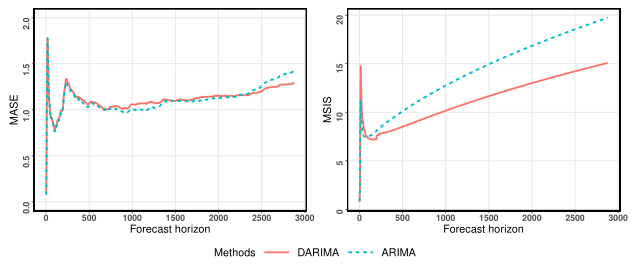
DARIMA always outperforms the benchmark method regardless of point forecasts or prediction intervals.
Distributed forecasting results

If long-term observations are considered, DARIMA is preferable, especially for interval forecasting.
The achieved performance improvements of DARIMA become more pronounced as the forecast horizon increases.
Benchmarking the performance of DARIMA against ARIMA for various forecast horizons.
Distributed forecasting results

Distributed forecasting results

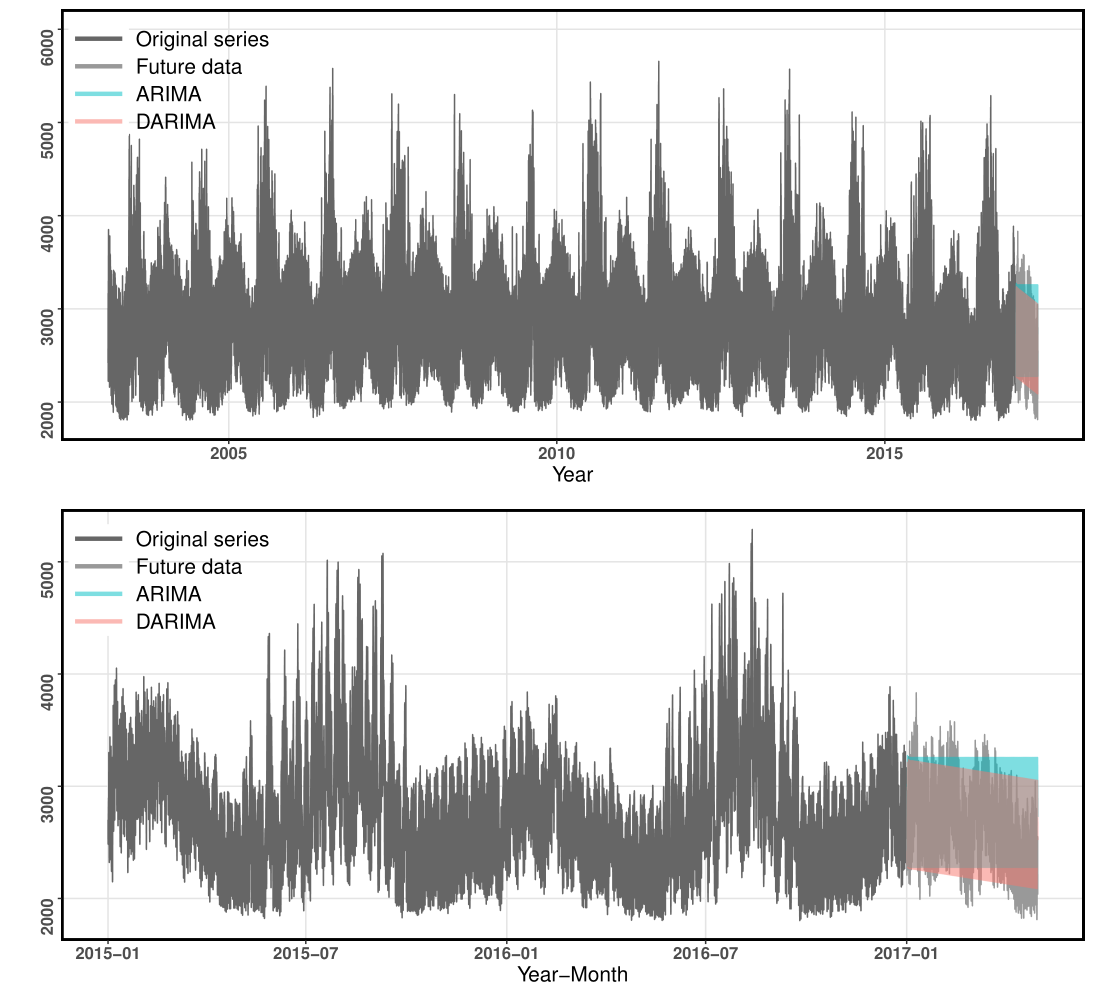
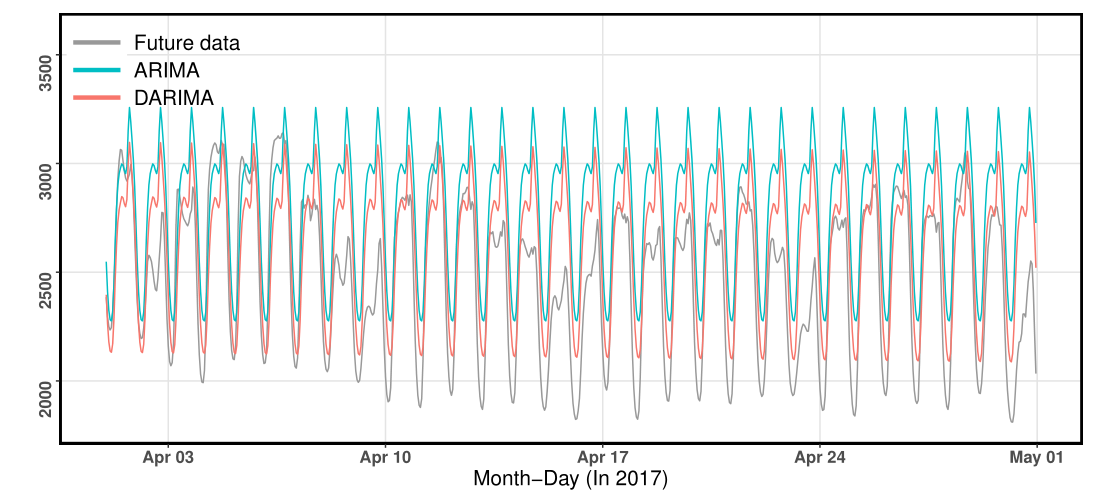
Our approach has captured the decreasing yearly seasonal trend.
Both DARIMA and ARIMA have captured the hourly seasonality, while DARIMA results in forecasts closer to the true future values than ARIMA.
Distributed forecasting results
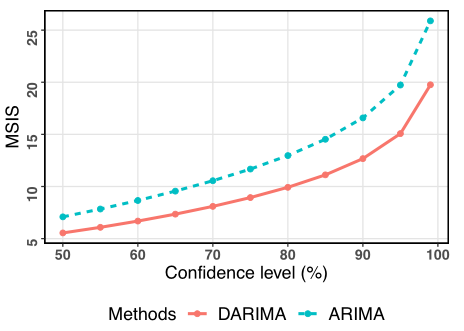
- MSIS results across different confidence levels

- Execution time

Conclusions
A distributed time series forecasting framework using the industry-standard MapReduce framework.
The local estimators trained on each subseries are combined using weighted least squares to minimize a global loss function.
Our framework
works better than competing methods for long-term forecasting.
achieves improved computational efficiency in optimizing the model parameters.
allows that the DGP of each subseries could vary.
can be viewed as a model combination approach.
Thanks!
Spark implementation: @xqnwang/darima
Website: https://xqnwang.rbind.io
Twitter: @Xia0qianWang