The uncertainty estimation of feature-based forecast combinations
Xiaoqian Wang
Beihang University
41st International Symposium on Forecasting
June 17, 2021
Joint work with
 |
 |
 |
|---|---|---|
| Yanfei Kang | Fotios Petropoulos | Feng Li |
| Beihang University | University of Bath | Central University of Finance and Economics |
Outline
Introduction
Feature-based interval forecasting framework
Weight determination
Application to the M4 competition data
Conclusions
Introduction
Motivation
Forecasting
Time series ![]()
- Point forecasts
- Probabilistic forecasts

Motivation
Forecasting
Time series ![]()
- Point forecasts
- Probabilistic forecasts
![]()
Forecasting method
Individual models
- Naïve
- Snaïve
- ARIMA
- ETS...
Motivation
Forecasting
Time series ![]()
- Point forecasts
- Probabilistic forecasts
Description
![]()
![]()
Forecasting method
Features
- Trend
- Linearity
- Nonlinearity
- Seasonality...
Individual models
- Naïve
- Snaïve
- ARIMA
- ETS...
Motivation
Forecasting
Time series ![]()
- Point forecasts
- Probabilistic forecasts
Description
![]()
![]()
Forecasting method
Features
- Trend

- Linearity Feature-based
- Nonlinearity forecasting
- Seasonality...
Individual models
- Naïve
- Snaïve
- ARIMA
- ETS...
Introduction
- Point forecasting mainly forecasts the mean or the median of the distributions for future observations.
- Probabilistic forecasting can provide a comprehensive outlook of the expected future value and the future uncertainty.
- Time series features provide valuable information for decision makers.
- The superiority of forecast combinations over a single model.
- No-free-lunch theorem (Wolpert & Macready, 1997).
- Horses for courses (Petropoulos et al., 2014).
- Merely tackling model uncertainty is sufficient to help (Petropoulos et al., 2018).
Challenges
- Previous literature mainly focuses on
- point forecasting + forecast combinations.
- How do features affect the uncertainty estimation of forecasts?
- How to guarantee the effectiveness of the relationship in forecasting a newly given dataset?
- How to translate the relationship into an attempt to improve the forecasting performance?
Feature-based probabilistic forecast combinations.
Feature-based interval forecasting framework
General framework

GRATIS (Kang et al., 2020)


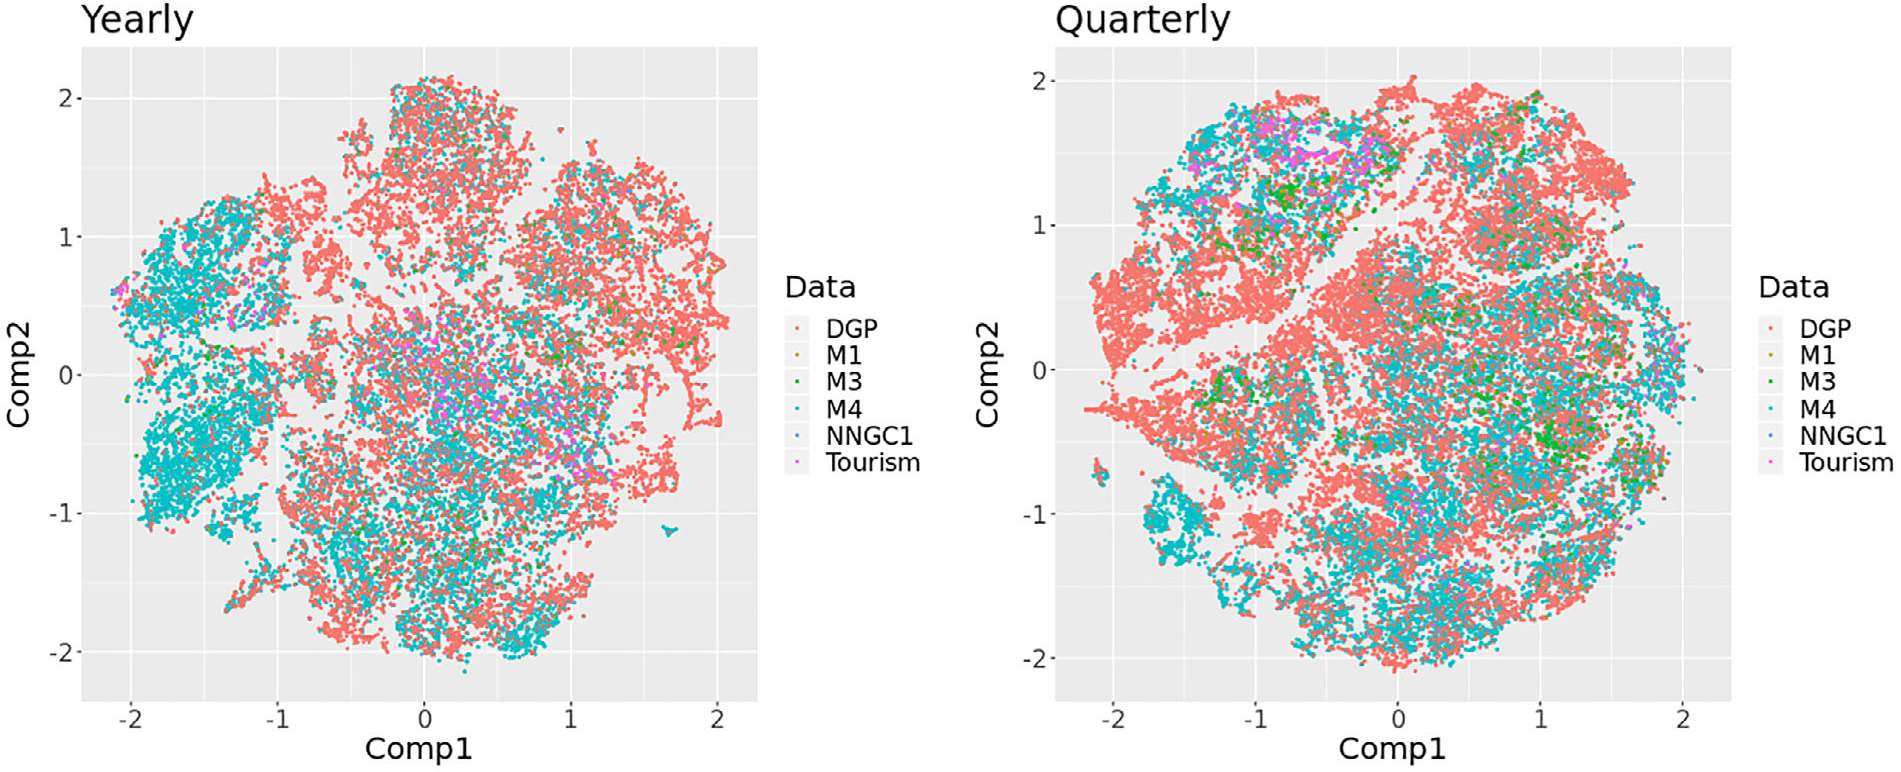
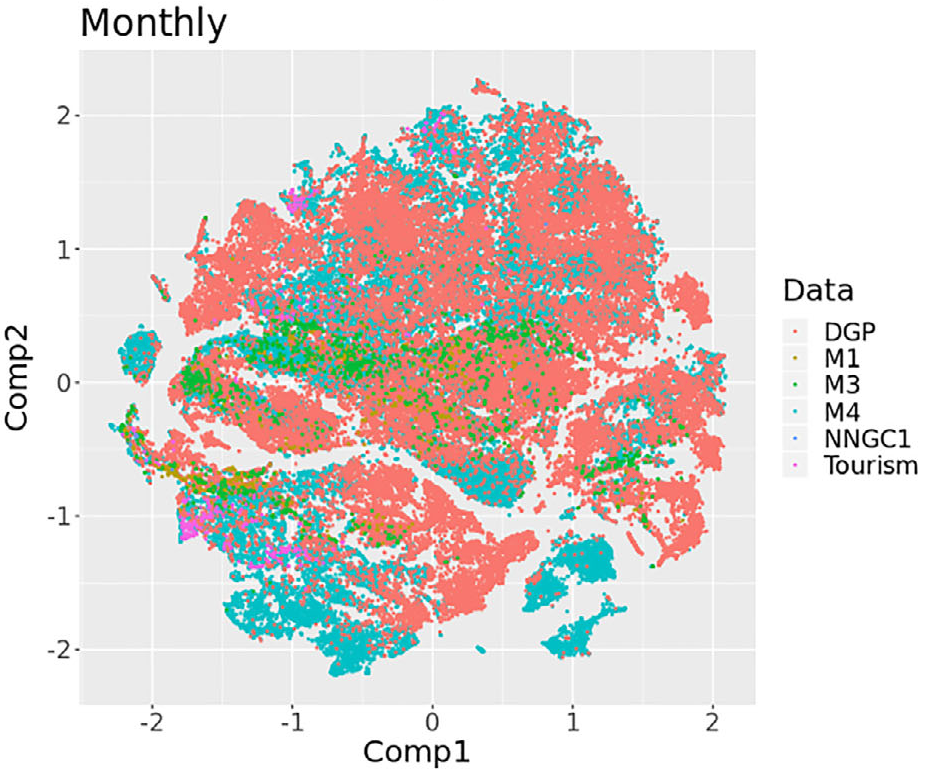
Dataset

Reference (GRATIS)

Test (M4)

Other components
42 times series features (R package
tsfeatures)Individual model pool

Interval forecast evaluation MSIS=1h∑n+ht=n+1(Ut−Lt)+2α(Lt−Yt)1{Yt<Lt}+2α(Yt−Ut)1{Yt>Ut}1n−m∑nt=m+1|Yt−Yt−m|
Linking features with performance
Why GAM?
- Interpretability
- Regularization
- Flexibility

GAM model for each individual model
- log(MSISN)⟺FN×P
Partial effect analysis
| Feature | Description | Range |
|---|---|---|
| seasonal_strength | Strength of seasonality | [0,1) |
| nonlinearity | Nonlinearity coefficient | [0,∞) |
| x_acf1 | The first autocorrelation coefficient | (−1,1) |

Partial effect analysis
The partial effect of one feature on the interval forecasting performance is distinct from the other features.
A feature has its unique way of affecting the interval forecasting performance of individual models.
Some features are biased towards up-weighting some forecasting models over others.

Weight determination
Weight assignment
Adjusted softmax function
Pij=exp{μi−^log(MSISij)σi}∑Mk=1exp{μi−^log(MSISik)σi},i=1,…,N;j=1,…,M
- Negative values can be down-weighted to near-zero.
- log(MSIS)↑⟹Accuracy↓⟹P↓
Optimal threshold ratio search
For ith time series,
- calculate the ratio of weight Rk=Pij/max.
- select individual models that satisfy R_{k}>Tr (0 < Tr \leq 1).
Combined forecasts
Combined prediction intervals
\begin{align} f_{wi}^l &= \frac{1}{\sum_{k=1}^{S}P_{ik}}\sum_{k=1}^{S}P_{ik}f_{ik}^l \\ f_{wi}^u &= \frac{1}{\sum_{k=1}^{S}P_{ik}}\sum_{k=1}^{S}P_{ik}f_{ik}^u \end{align}
Combined point forecasts
\begin{align} f_{wi} = \frac{1}{2}(f_{wi}^l + f_{wi}^u) \end{align}
we assume the intervals to be symmetric around the point forecast
Optimal threshold ratio search

- Model combination \longrightarrow Model selection.
- Tr = 0 indicates that all the methods from the pool are selected.
- Tr = 1 indicates that only the method with the minimal fitted \log(\mathrm{MSIS}) is selected.
A larger threshold value means that fewer methods are selected for model combining, while a smaller threshold value means that many more methods are used for model combining.
This indicates that con- trolling the number of methods using the threshold searching algorithm is beneficial for improving the forecasting performance.
Application to the M4 competition data
Selection rates of each model

Performance for different confidence levels

Forecasting results

Conclusions
Conclusions
Features are taken into account to estimate the uncertainty of forecasts (cross-learning).
We propose an optimal threshold ratio searching algorithm to select an appropriate subset of models per time series for model combination.
Our approach outperforms a variety of individual models with distinctions for both point forecasts and prediction intervals.
Thanks for your attention!
Paper: Wang et al., (2021, JORS)
R package: https://github.com/xqnwang/fuma